AGRICULTURE
Plots are a common tool used in quality control for post-processed solutions. There are many combinations of plots that are useful determining the quality of a solution; such combinations will be addressed in the use cases in the following section.
The plot window can be accessed by clicking the corresponding button located on the toolbar, the function key shortcut F7, or through the menu bar:
Output | Plot Results
Many users may find themselves conducting quality control on the same type of applications; thus, it may be convenient to create a plot group which will output predefined plots upon selection. Plot groups can be set to output an HTML report which can greatly simplify the process of reporting QC results.
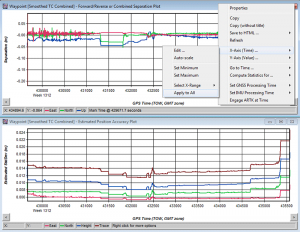
It is good practice when analyzing multiple plots during QC analysis to ensure the plots are displayed with the same scales. There many plot management options that appear when a plot is right-clicked.
It is extremely useful to set minimum and maximum ranges on axes to zoom-in on interesting data.